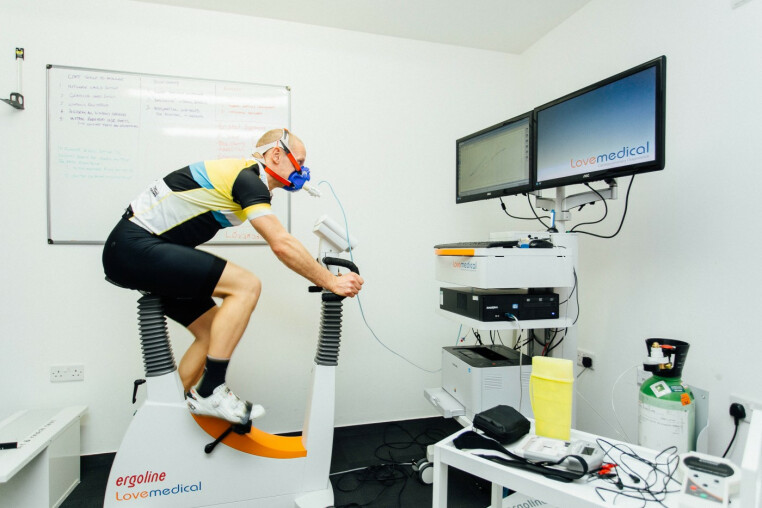
V02 max testing and performance analysis
Physiology data collected from male cyclist during incremental step test on cycle ergometer.
Variables measured -Blood lactate, oxygen uptake, power and heart rate.
Images 1 and 3 represent graphed physiological data during a cycling performance test, with different exercise intensity zones highlighted and key physiological markers like the Aerobic Threshold (AT, VT1) and Respiratory Compensation Point (RCP, VT2) indicated.
Physiological Zoning & VT1:
VT1 (Aerobic Threshold - AT) is a crucial marker where the body shifts from primarily fat oxidation to increased carbohydrate reliance.
In the green zone, which corresponds to VT1, there is:
A notable shift where lipid (fat) metabolism decreases (blue line drops).
Carbohydrate metabolism increases (purple line rises).
Heart rate (red line) shows a steady increase, reflecting a transition into moderate intensity.
Beyond VT1, the body starts relying more on carbohydrates for energy, with decreasing fat oxidation.
Comparison of Physiological Data Between First and Second Test Dates
By analyzing both graphs, we can assess physiological improvements in the cyclist’s endurance and metabolic efficiency.
Key Observations & Improvements:
Shift in VT1 (Aerobic Threshold - AT) to a Higher Load
In the first test, VT1 occurred at a lower workload (~125-150W).
In the second test, VT1 occurs at a higher workload (~250W).
This indicates improved aerobic efficiency, meaning the cyclist can sustain a higher workload before shifting to greater carbohydrate reliance.
Increased Fat Utilisation at Higher Intensities
In the first test, lipid (fat) oxidation at low to moderate intensity peaks at 2.9 Kcal/min versus 4.7 Kcal/min in the retest.
This suggests improved metabolic flexibility, allowing the cyclist to use fat for energy at higher workloads, delaying glycogen depletion.
Delayed VT2 (Respiratory Compensation Point - RCP)
RCP in the first test occurred around 225W.
In the second test, RCP occurs at ~300W or beyond.
This indicates improved anaerobic threshold, meaning the cyclist can tolerate higher intensities before performance drops due to fatigue.
The transition to primarily carbohydrate usage (purple line increasing) occurs at a higher load in the second test.
This means the cyclist can perform at a higher intensity while preserving glycogen stores.
Images 2 and 4 show the breakdowns of carb and fat usage associated with each zone. Given here in % and visual bar chart format. The difference in efficiency in each zone between tests is very clear to see.
Performance Implications
Increased VT1 means the cyclist can ride at higher intensities before fatigue sets in.
Improved fat oxidation means better endurance capacity and efficiency in long rides.
Delayed RCP means the cyclist can sustain near-maximal efforts for longer durations.
Overall, the data shows significant endurance and metabolic efficiency gains, due to targeted aerobic training.
Duis mollis, est non commodo luctus, nisi erat porttitor ligula, eget lacinia odio sem nec elit. Integer posuere erat a ante venenatis dapibus posuere velit aliquet. Sed posuere consectetur est at lobortis. Nullam quis risus eget urna mollis ornare vel eu leo.
or receive periodic updates and advice by subscribing to our newsletter